GDB Overview
GDB is a powerful debugger for C, along with many other languages. It's part of the GNU package, which contains free software (the gcc compiler, emacs, etc.) that is installed on the virtual machine that we provided you. As a result, GDB is the debugger used by CSCI3150 at CUHK. Learn to love it; GDB pros have a much easier time tracking down bugs that those who muddle through using guesses and infinite amounts of printf statements. Also, for many geeks GDB can assist in hacking.
This lab tutorial is designed to give you a brief introduction to using GDB for CSCI3150. We give you a simple example of hacking as well to show how powerful GDB is. It's purposely short: the idea is that you get the basics here and check out the online GDB manual when you want more.
Invoking and Quiting GDB
Here, we use a very simple example helloworld.c to show how to invoke and quit GDB, which will give you a straightforward institution.
#include <stdio.h>
int main(int argc, char * argv){
    printf("Hello World\n");
    return 0;
}
To compile helloworld.c for debugging, you have to tell your compiler to compile your code with symbolic debugging information included. Here's how to do it with gcc, with the -g switch:
$ gcc -g helloworld.c -o helloworld
Once you've done that, a executable file named helloworld can be view in the current directory.
Invoking GDB
Things first: you can enter gdb --help in your terminal and get the help information. Pay attention to this switch --tui, we will open this switch later. Now, let's fire it up.
There are several ways to start the debugger (e.g. if you were an IDE you might start it with a particular mode that's not so human-friendly) but I'll mention two of them here: vanilla console mode and curses GUI mode. The GUI is better, but let's quickly cover the simple one, and launch the program helloworld in the debugger:
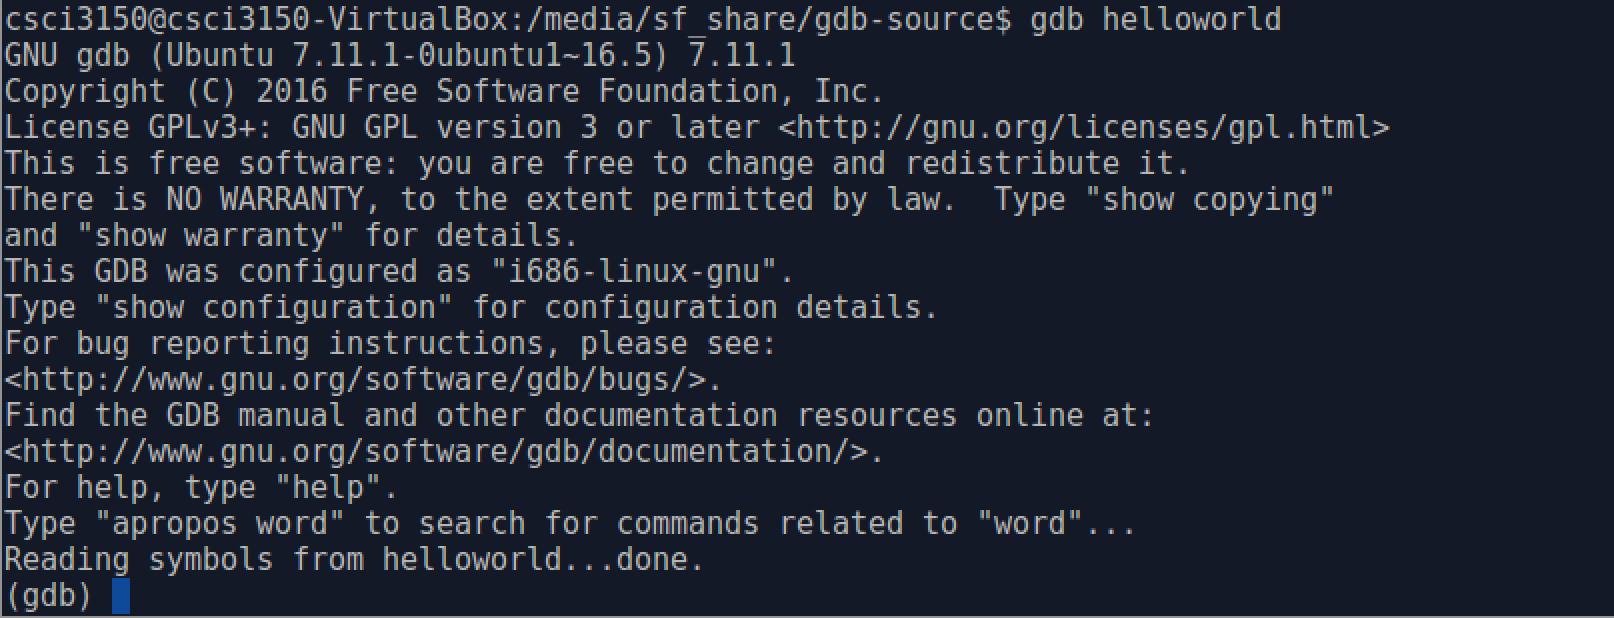
The last line is the gdb prompt, waiting for you to tell it what to do. Type run(abbreviated r) to run the program (gdb allows you to abbreviate commands until they become ambiguous.).
To start in neato and highly-recommended GUI mode, start the debugger with gdb --tui, here, we open the --tui switch, which was mentioned above.
And here's a screenshot of what you'll see, approximately,

All the normal gdb commands will work in GUI mode, and additionally pgup/pgdown keys will scroll the source window. Also, you can change which file or function is displayed in the source window by giving the command list with a location as an argument, for example, list helloworld.c:5 to bring up the file helloworld.c on line 5. (See Breakpoints, for sample location--the same locations that work with breakpoints will work with the list command.) As a side note, list also works in dumb terminal mode.
As you know, sometimes we need enter some argments, for example arg1 arg2, to the parameter argv of main() function. You may type as follows:
$ gdb helloworld arg1 arg2
It is straightforward, but unfortuately it does not work.
The correct method is using gdb helloworld to start debugger, and then entering run arg1 arg2 in the gdb prompt.
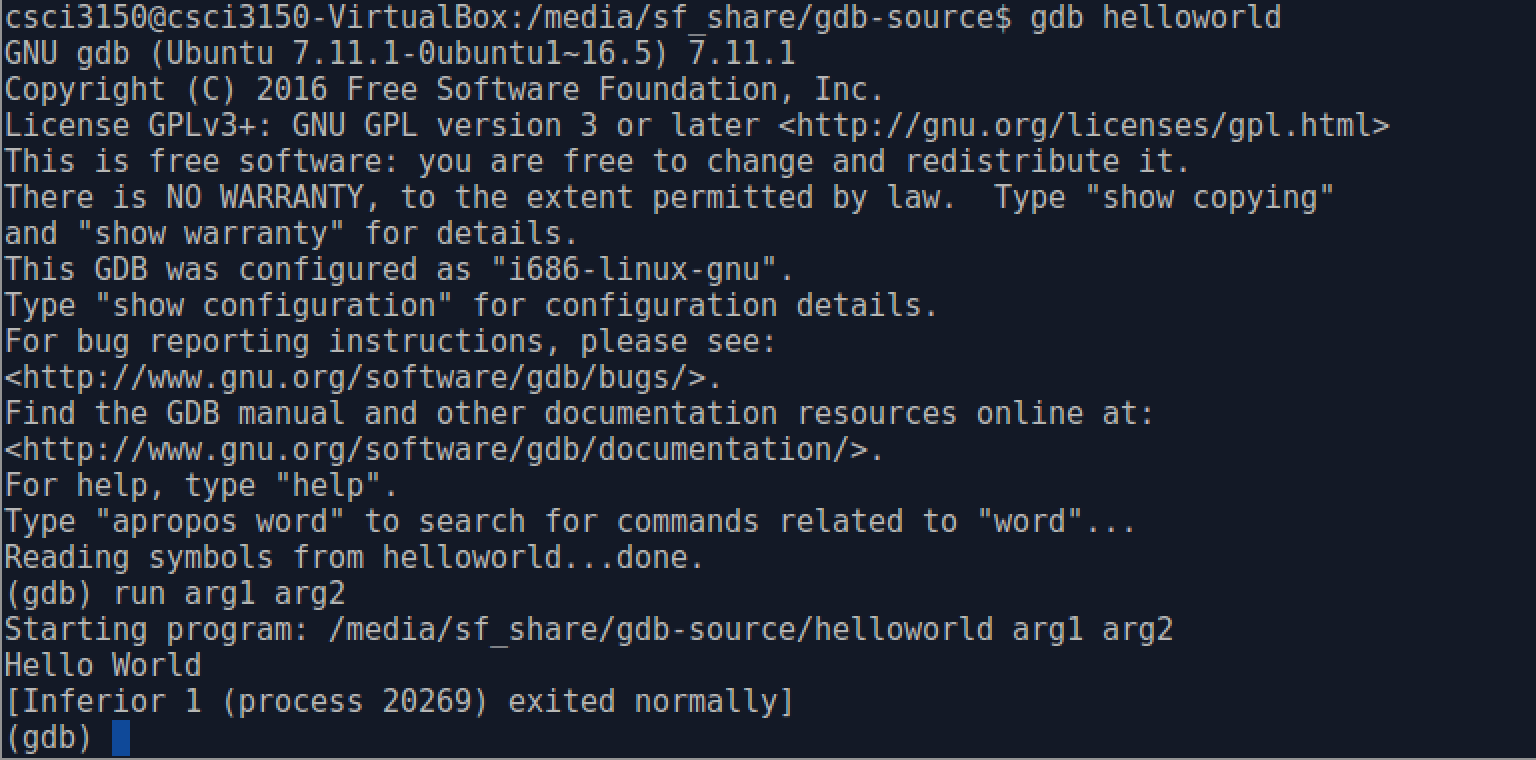
In fact, the program starts to run after we enter run arg1 arg2. So, it is reasonable to pass arguments in such way.
Quitting GDB
We can enter quit(abbreviated q) in the gdb prompt to quit GDB, or maybe some people like using ctrl+d to quit gdb.