Breakpoints
Here we start to debug a mini program computeSeriesValue. For showing how to set breakpoints in variant ways, we divide code among two source files, main.c and computeSeriesValue.c.
main.c:
#include<stdio.h>
#include<stdlib.h>
#include<math.h>
extern double computeSeriesValue(double x, int n);

int main(int argc, char * argv[]){
    double x;
    int n;
    x = atof(argv[1]);
    n = atoi(argv[2]);
    printf("This program is used to compute the value of the following series:\n");
    printf("(x^0)/0! + (x^1)/1! + (x^2)/2! + (x^3)/3! + (x^4)/4! + ...... + (x^n)/n!\n");
    printf("The value of the series for x=%f, n=%d is %f\n", x, n, computeSeriesValue(x, n));
    return 0;
}
computeSeriesValue.c:
#include<stdio.h>
int computeFactorial(int number) {
    int fact = 0;
    for(int j = 1; j <= number; j++) {
        fact = fact *j;
    }
    return fact;
}
double computeSeriesValue(double x, int n) {
    double seriesValue = 0.0;
    double xpow = 1;
    for(int k = 0; k <= n; k++){
        seriesValue += xpow / computeFactorial(k);
        xpow = xpow * x;
    }
    return seriesValue;
}
makefile:
CC=gcc
CFLAG=-g
SRC=main.c computeSeriesValue.c
computeSeriesValue:$(SRC)
    $(CC) $(CFLAG) $(SRC) -o computeSeriesValue
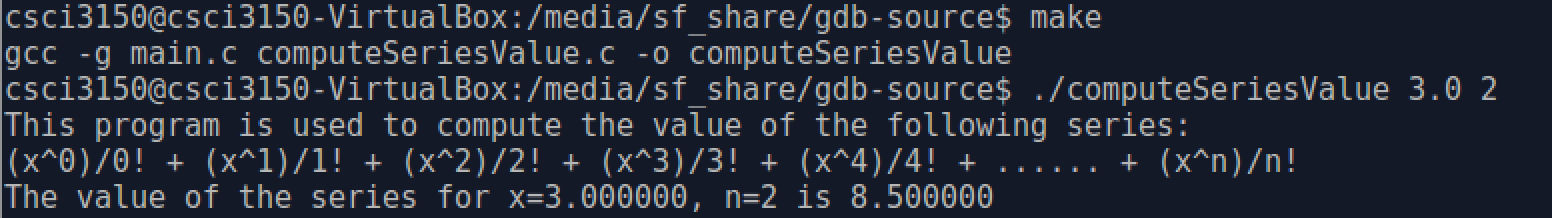
This program is used to compute the value of the following series:
(x^0)/0! + (x^1)/1! + (x^2)/2! + (x^3)/3! + (x^4)/4! + ...... + (x^n)/n!
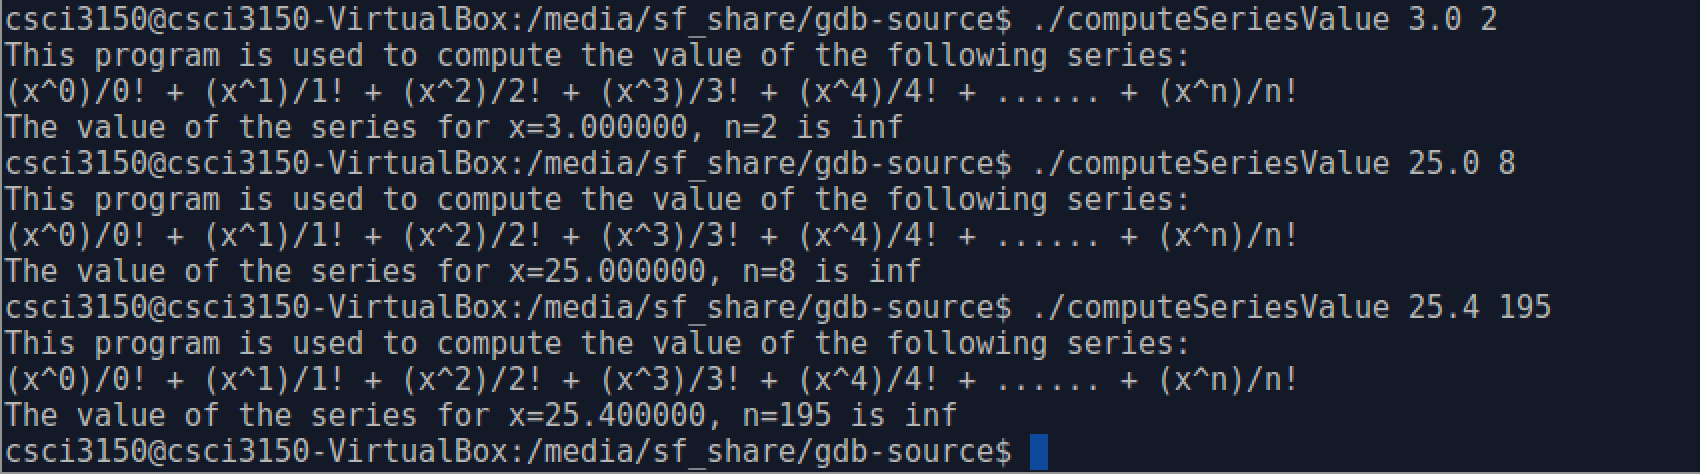
Makefile has been prepared for you, you just need enter make in the terminal prompt to compile the source files. Howere, whenever you execute computeSeriesValue given x and n(n>=0, and n should be an integer) as input, the program outputs a value of infinity, regardless of the input.
Apparently, there are some bugs in this program. So we can use GDB to debug it. Let's fire it up now.
Setting Breakpoints
Just starting the debugger to run the program straight through isn't very useful—we need to stop execution and get into stepping mode.
Normally, your program only stops when it exits. Breakpoints allow you to stop your program's execution wherever you want, be it at a function call or a particular line of code. Breakpoints are an essential tool that allow you to stop and examine the program state at a specific context within the execution. Before you enter run in gdb prompt to start your program, you want to set up your breakpoints. The break(abbreviated b) command will allow you to do so. Here we list three methods to set breakpoints, which are normally used and powerful.
break mainBreak at the beginning of main() functionbreak 5Break at line 5 of current filebreak main.c:5Break at line 5 of main.c file
In order to debug computeSeriesValue, we set breakpoints before starting the program.
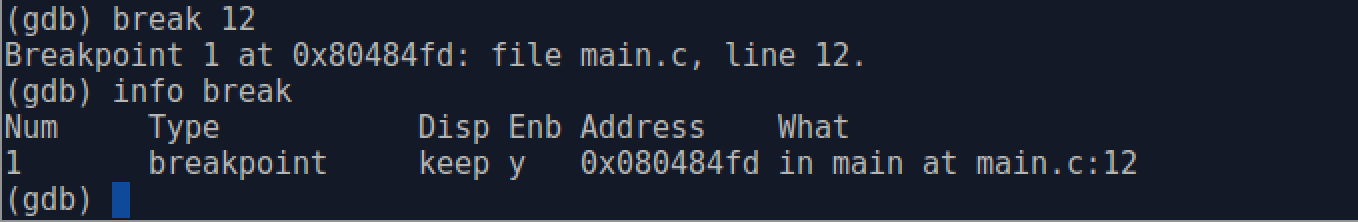
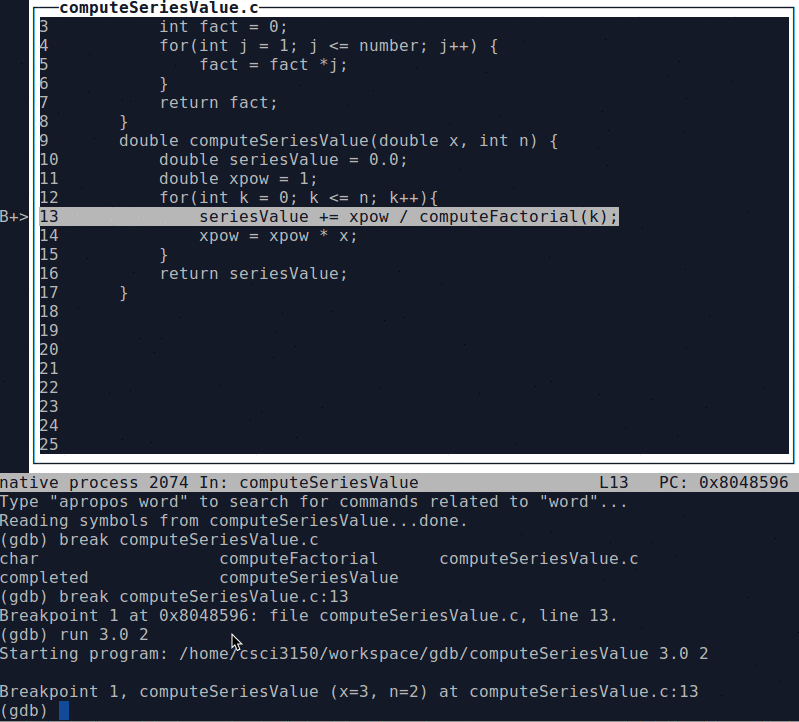
(1) Set a breakpoint at line 12 of current file main.c. You can use command info break to view the breakpoints that you have set.
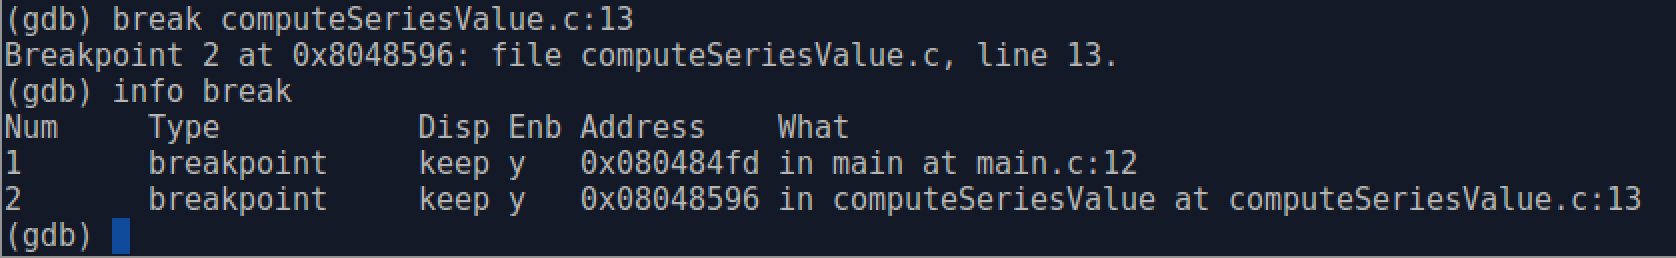
(2) Break at line 13 of computeSeriesValue.c. Use list(abbreviated l) command to show a spcific line in a source file.
(3) Break at the begining of function computeFactorial().
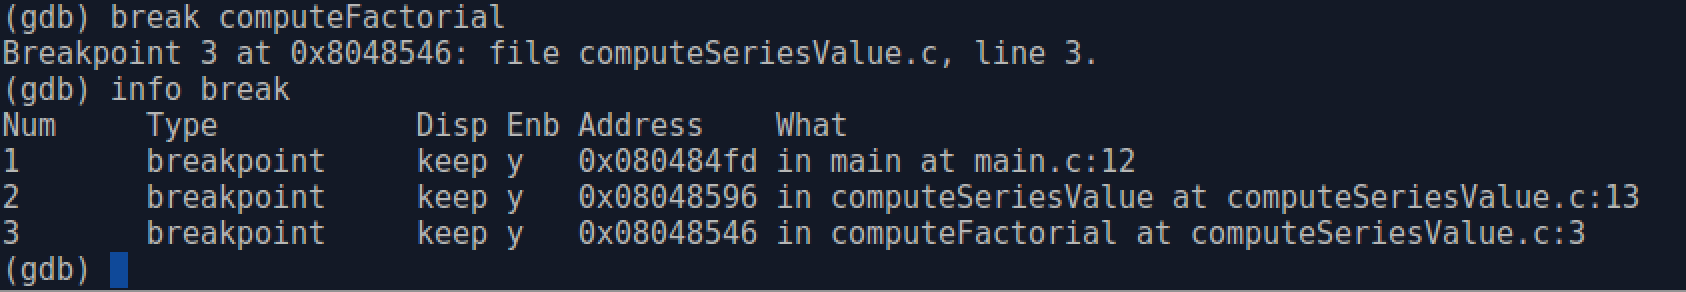
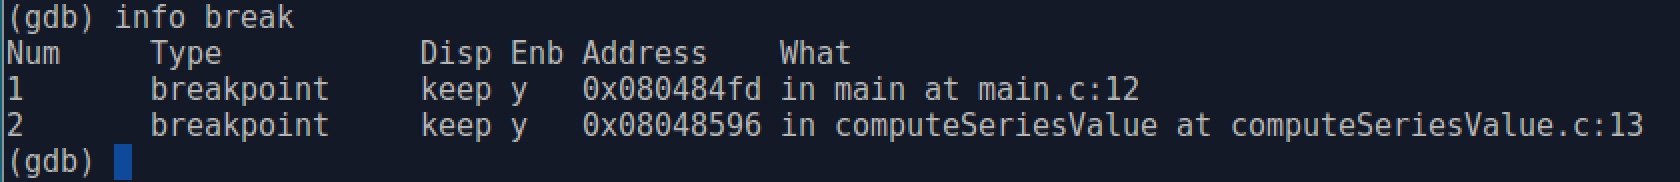
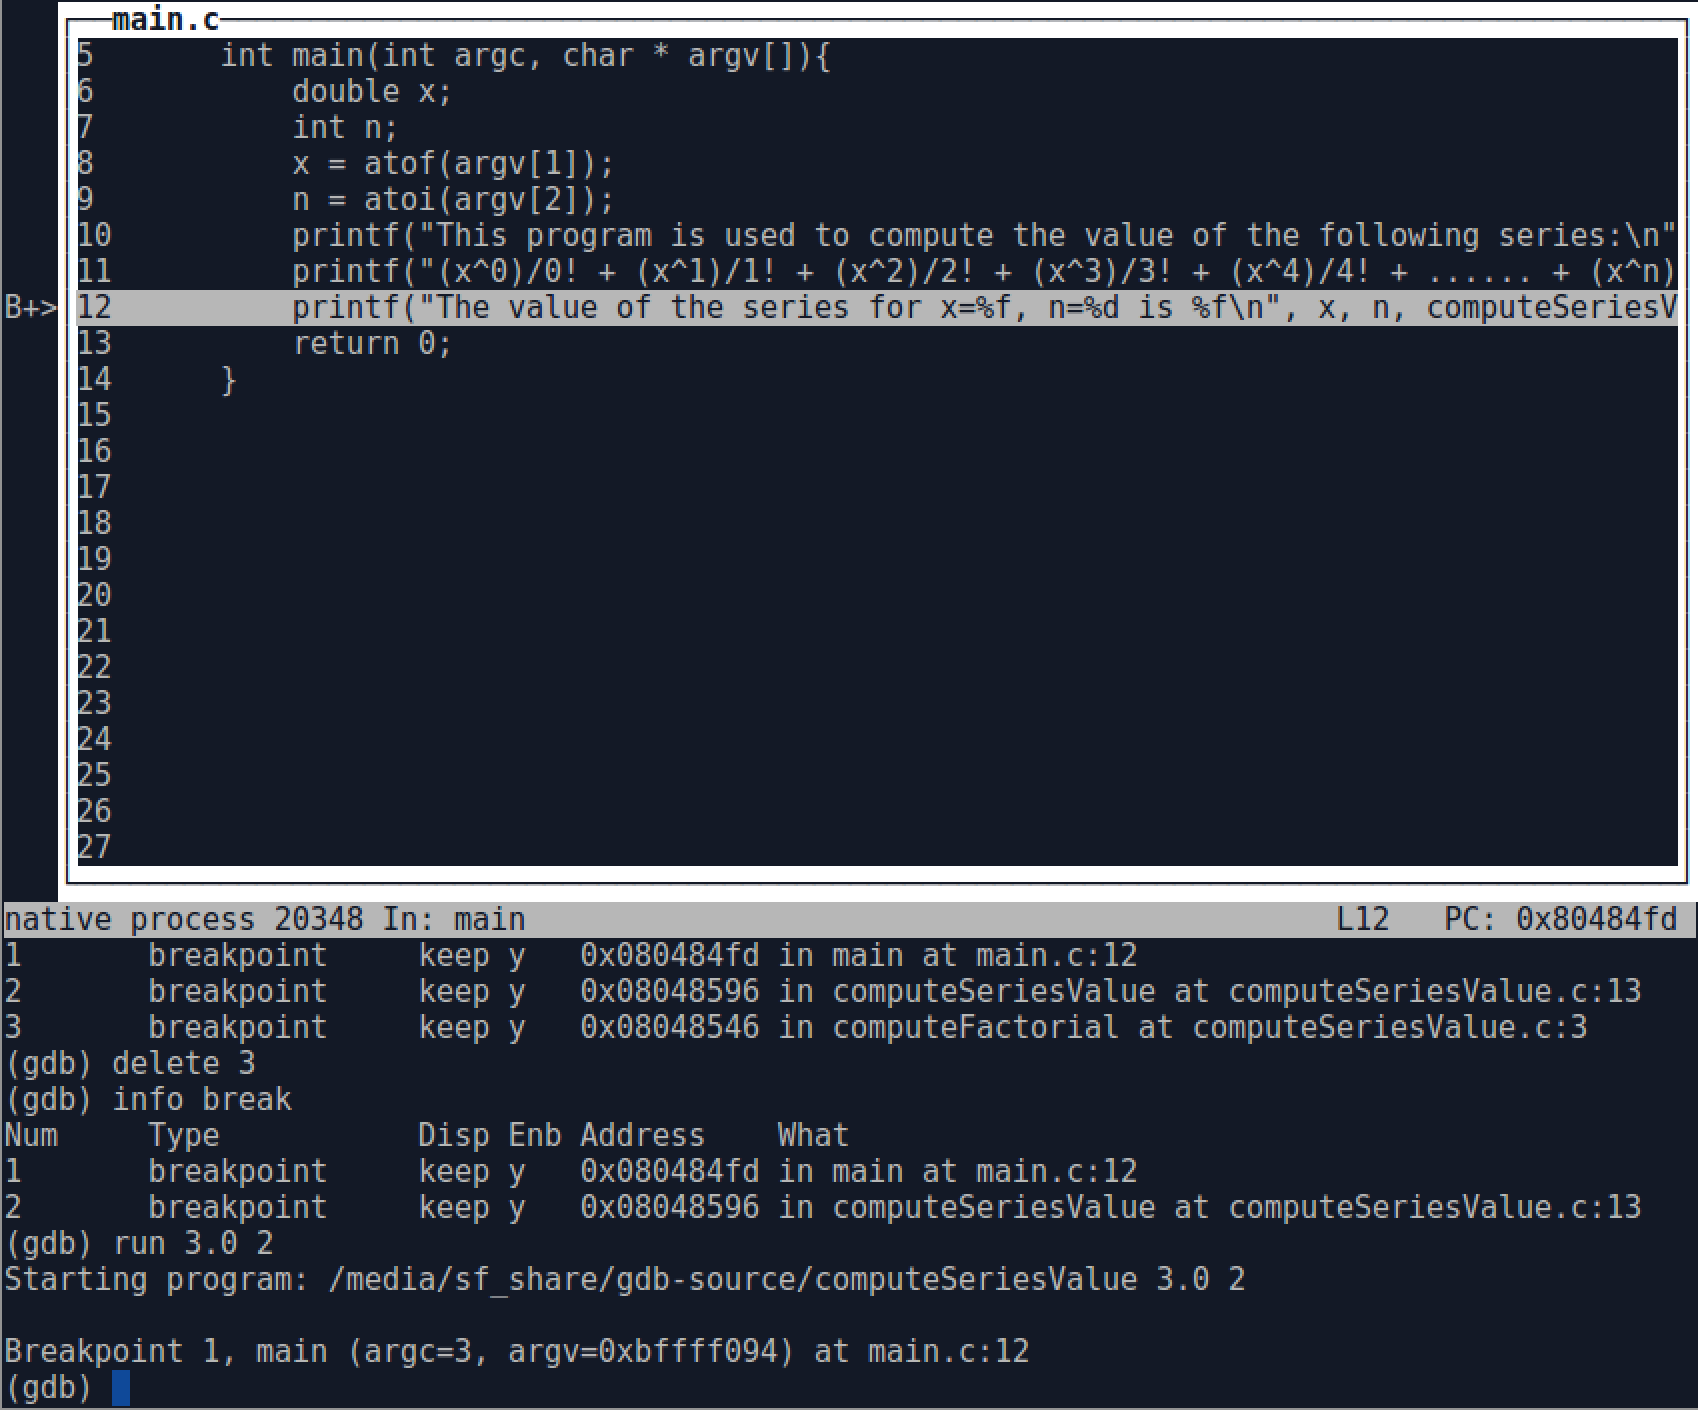
To clear a breakpoint, use the clear command with the breakpoint location. You can aslo clear a breakpoint by number with delete command. Sometimes, we may find that some breakpoints are not necessary. For example, the breakpoint at the begining of function computeFactorial() is redudant. So, here we use delete 3 command to clear the third breakpoint.
Stepping Arround
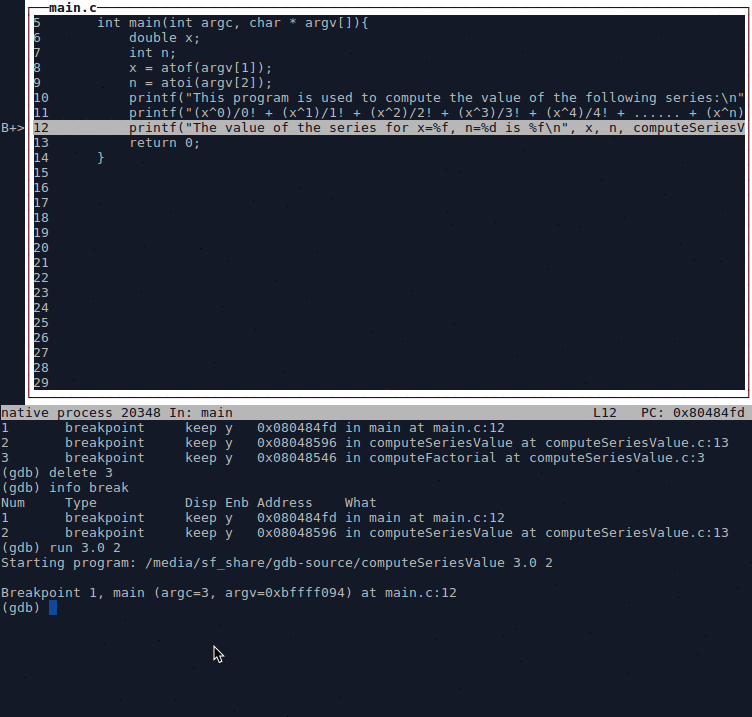
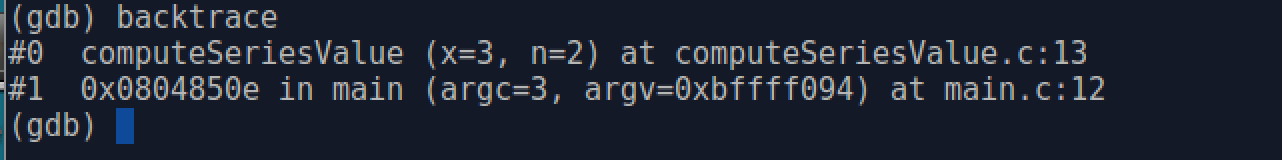
After entering run 3.0 2(the correct output should be 8.5), we've arrived at main() and execution has stopped at the breakpoint we set there. If you're running in dumb terminal mode, gdb will print the line it will execute next. Here, we're running in cool GUI mode, with switch --tui open, the line it will execute next will be highlighted in the source window.
In order to execute the next line and step into function computeSeriesValue(), enter step(abbreviated s) command in the gdb prompt. We also use next(abbreviated n) command, which is similar to step except it will step over (instead of into) functions. Finally we reach the next breakpoint. For executing the program consecutively not step-by-step from one breakpoint to next one, we can use continue(abbreviated c) command.
If we want to know where we are in the program's execution(and how, to some extent, we got there), we can view the contents of the stack using the backtrace(abbreviated bt) commands as follows:
Inspecting Variables
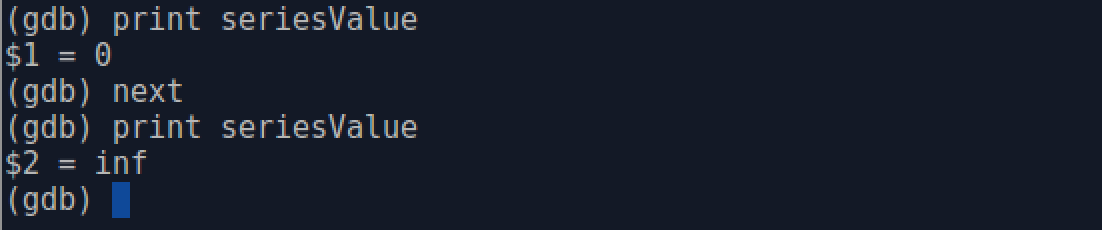
Along with the step and next commands, we can use print(abbreviated p) command to print the values of variables. When arriving at the breakpoint at line 13 of computeSeriesValue.c, print value of seriesValue, then step over function computeFactorial() with next command, print seriesValue again. We find that seriesValue become inf.
You know we are very interested in the variable seriesValue, there is a simple method to inspect this variable with display command. GDB will print the values of variables that we are interested automatically every step. To view the information of display, info display can help. We can use undisplay followed by a variable number, which command info display will show, to cancel the inspect of this variable.
Now, we can know that the expression xpow/computeFactorial(k) is inf. Here xpow is 1 and k is 0. It is sure that bugs locate in function computeFactorial(). After analyzing the source code of this function, we find that int fact = 0 will make return value of this function always be 0. Bingo! We find the bug, and replace int fact = 0 with int fact = 1 then.
We compile the source code by make and test the program as follows: